Spatially and Temporally searching data within the azmpdata package
Emily Chisholm and Jaimie Harbin
Source:vignettes/search_azmpdata.Rmd
search_azmpdata.RmdIntroduction
The Atlantic Zone Monitoring Program (AZMP) was implemented in 1998 to help provide more information about the marine ecosystems (Therriault et al. 1998). As described by Casault et al. 2020, the AZMP data are collected at “a network of sampling locations (fixed-point, high-frequency sampling stations, cross-shelf sections, ecosystem trawl surveys) in four DFO regions (Québec, Gulf, Maritimes, and Newfoundland) sampled at a frequency of twice-monthly to once-annually” (see Figure 1 of Casault et al. 2020 for a visual). In addition to the AZMP data, 2019 air-temperature trends, ice cover, sea surface temperature (SST) and physical oceanographic were sampled on the Scotian Shelf, Bay of Fundy, and the Gulf of Maine (see Figure 1 of Hebert et al. 2021 for a visual). These two data sets were combined as a basis for a zonal Science Advisory Report (DFO 2019). The mentioned data, with the exception of area-temperature, can be found in this azmpdata package.
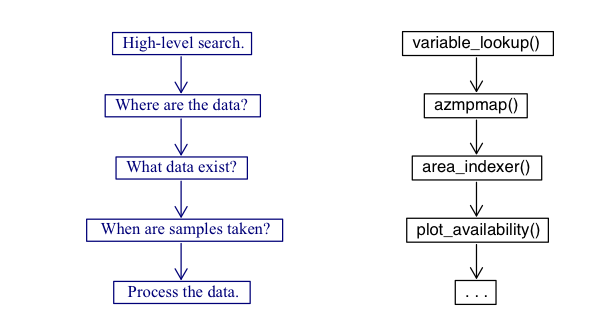
This vignette will describe how to effectively analyze, both
spatially and temporally, the data contained within the
azmpdata package. To do so, basic R functions combined with
built-in functions, variable_lookup(),
azmpmap(), area_indexer(), and
plot_availability() will be explained. A suggested work
flow is shown below to help the user navigate the package.
Searching the data
Basic R functions
Listing all the available dataframes in a package can be a quick way to see a high level overview of the datasets. The output from the following code will display all the dataframe names as well as brief, high-level descriptions. This data will appear in a new window.
data(package = 'azmpdata')You can browse through the help documentation for all datasets, and functions in the package by calling the code below. This information will come up in the R studio help window.
help(package = 'azmpdata')Clicking on a specific dataframe name or function in the help window will bring you to a detailed help page. For dataframes, this help page will include variable names and definitions, as well as information about the source of the data and the proper citation.
R studio provides some built in capability to be able to search
through the help files for a given package. The function
help.search() can be used to search through titles and
descriptions of help files in a package.
help.search(pattern = 'section', package = 'azmpdata')This code will bring up all the help files (in the R studio help
window), which match the pattern provided. Note, that this
does not search through the entire text of the help
file, for more details see lookup_variable() in the next
section.
variable_lookup()
This is the first step in the suggested work flow for the
azmpdata package. We have created a custom search function
in azmpdata which allows a user to search the package in
two ways. One, search for keywords in the names of all variables,
included in all datasets of the package. Two, search for keywords in the
entirety of the package help text (including the details
sections, which often contains variable definitions and is not searched
through when using help.search()).
The output of this function will be a table with three columns,
keyword, or the search keyword that was provided, that has
been matched (this is useful if providing multiple keywords),
variable, the name of the variable which matched your
keyword search, and dataframe which will be the name of the
dataframe in which your matched variable is contained, or if searching
through the help text, the name of the dataframe where your keyword was
found in the help text.
This function can be provided with a single keyword,
variable_lookup('nitrate')## # A tibble: 10 × 3
## keyword variable dataframe
## <chr> <chr> <chr>
## 1 nitrate integrated_nitrate_0_50 Derived_Annual_Sections
## 2 nitrate integrated_nitrate_0_50 Derived_Annual_Stations
## 3 nitrate integrated_nitrate_0_50 Derived_Occupations_Sections
## 4 nitrate integrated_nitrate_0_50 Derived_Occupations_Stations
## 5 nitrate integrated_nitrate_50_150 Derived_Annual_Sections
## 6 nitrate integrated_nitrate_50_150 Derived_Annual_Stations
## 7 nitrate integrated_nitrate_50_150 Derived_Occupations_Sections
## 8 nitrate integrated_nitrate_50_150 Derived_Occupations_Stations
## 9 nitrate nitrate Discrete_Occupations_Sections
## 10 nitrate nitrate Discrete_Occupations_Stationsor multiple keywords.
variable_lookup(c('nitrate', 'integrated'))## # A tibble: 32 × 3
## keyword variable dataframe
## <chr> <chr> <chr>
## 1 integrated integrated_chlorophyll_0_100 Derived_Annual_Sections
## 2 integrated integrated_chlorophyll_0_100 Derived_Annual_Stations
## 3 integrated integrated_chlorophyll_0_100 Derived_Occupations_Sections
## 4 integrated integrated_chlorophyll_0_100 Derived_Occupations_Stations
## 5 integrated integrated_nitrate_0_50 Derived_Annual_Sections
## 6 integrated integrated_nitrate_0_50 Derived_Annual_Stations
## 7 integrated integrated_nitrate_0_50 Derived_Occupations_Sections
## 8 integrated integrated_nitrate_0_50 Derived_Occupations_Stations
## 9 integrated integrated_nitrate_50_150 Derived_Annual_Sections
## 10 integrated integrated_nitrate_50_150 Derived_Annual_Stations
## # ℹ 22 more rowsIn order to search through the help text, use the option
search_help
variable_lookup('nitrate', search_help = TRUE)## Joining with `by = join_by(keyword, variable, dataframe)`## # A tibble: 19 × 3
## keyword variable dataframe
## <chr> <chr> <chr>
## 1 nitrate integrated_nitrate_0_50 Derived_Annual_Sections
## 2 nitrate integrated_nitrate_0_50 Derived_Annual_Stations
## 3 nitrate integrated_nitrate_0_50 Derived_Occupations_Sections
## 4 nitrate integrated_nitrate_0_50 Derived_Occupations_Stations
## 5 nitrate integrated_nitrate_50_150 Derived_Annual_Sections
## 6 nitrate integrated_nitrate_50_150 Derived_Annual_Stations
## 7 nitrate integrated_nitrate_50_150 Derived_Occupations_Sections
## 8 nitrate integrated_nitrate_50_150 Derived_Occupations_Stations
## 9 nitrate nitrate Discrete_Occupations_Sections
## 10 nitrate nitrate Discrete_Occupations_Stations
## 11 nitrate NA area_indexer
## 12 nitrate NA Derived_Annual_Sections
## 13 nitrate NA Derived_Annual_Stations
## 14 nitrate NA Derived_Occupations_Sections
## 15 nitrate NA Derived_Occupations_Stations
## 16 nitrate NA Discrete_Occupations_Sections
## 17 nitrate NA Discrete_Occupations_Stations
## 18 nitrate NA plot_availability
## 19 nitrate NA variable_lookupNote, that if the search returns a match to your keyword in the text
of a help file, the output will not return a specific variable name in
the variable column (instead it will return NA), and will
give you only the dataframe name in the dataframe
column.
R functions and variable_lookup combined
Once you have your search results, you may want to call the dataframe
which matched your search terms. This is very straight-forward if using
our custom search function variable_lookup()
ans <- variable_lookup(keywords = 'wet weight', search_help = TRUE)

df <- get(ans$dataframe[1])
Spatially displaying data: azmpmap()
Once the user has a general idea of what is contained within the
package using variable_lookup(), the next logical step,
step 2 of the workflow, is to locate where the samples are taken. To do
so, we have created the azmpmap() function. This function
generates a leaflet plot of the geospatial files. The user then has the
option to focus in on different stations, sections, and areas with the
ability to double-click to see the name, depth, and associated
dataframes. To try out azmpmap() use the following
code:
azmpmap()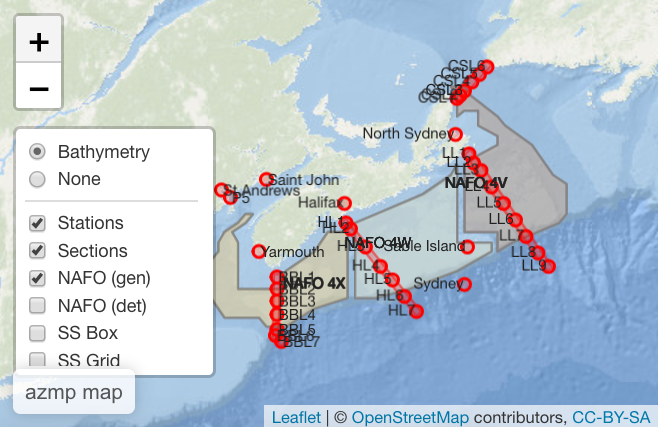
For example, if a user wanted to know the frequency (ie. samples/month) for the sea surface height at Halifax, they would type in the following:
plot_availability(areaType = "station", areaName="Halifax", parameters="sea_surface_height")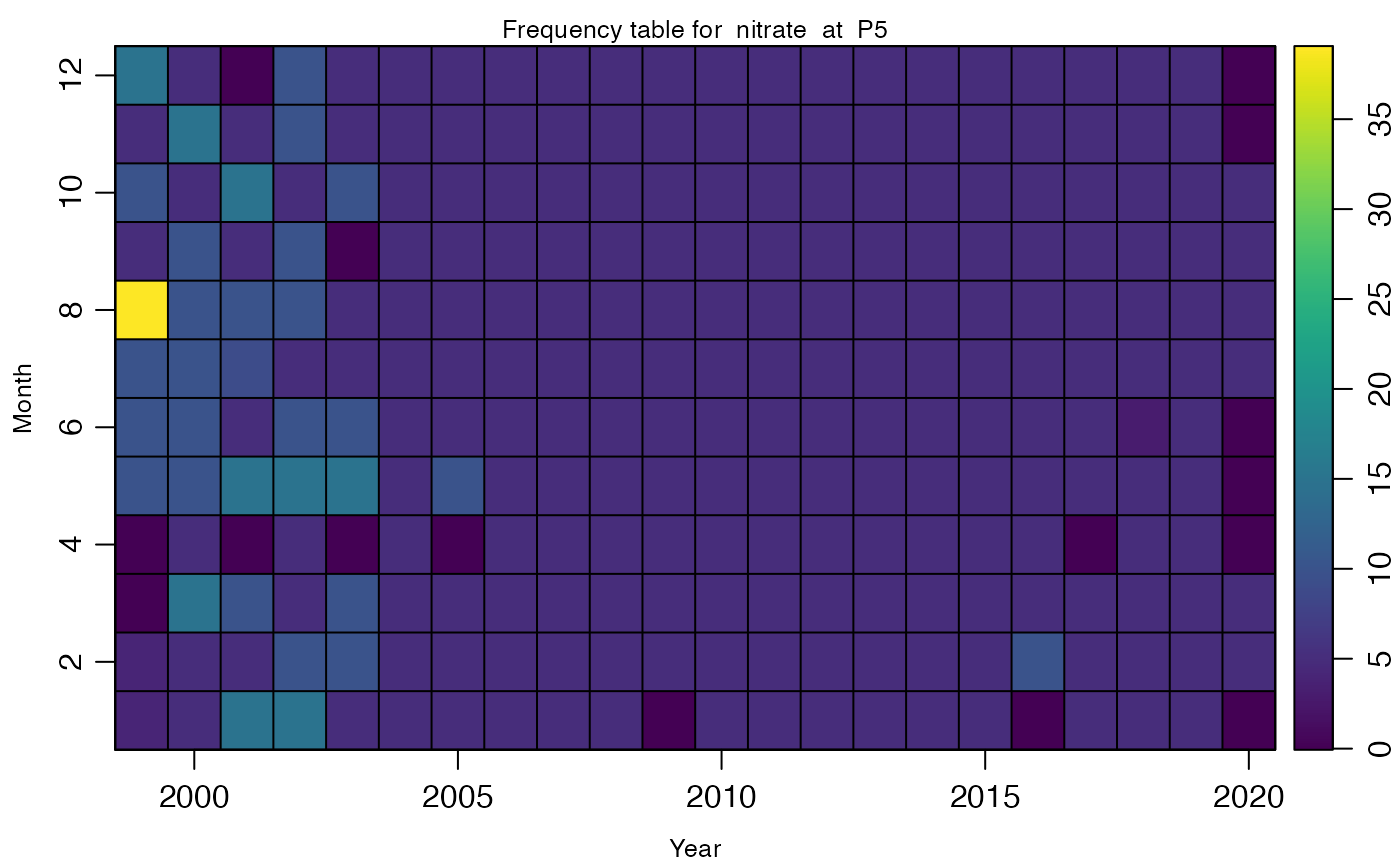
Figure 3: Sampling freqency per month for sea_surface_height at Halifax
## Plot generated for sea_surface_height at HalifaxConclusion
The package azmpdata contains a wealth of datasets to
help analyze AZMP data. It is recommended that the users utilize the
built in functions in the following order 1)
variable_lookup(), 2) azmpmap()
to easily
search through the data and efficiently analyze both spatially and
temporally. For more information on base R search functions please feel
free to do your own research. For questions about the custom
azmpdata search please contact developers or bring an issue
to the github board (listed in the package description under
BugReports).
References
Casault, B., Johnson, C., Devred, E., Head, E., Cogswell, A., and Spry, J. 2020. Optical, Chemical, and Biological Oceanographic Conditions on the Scotian Shelf and in the eastern Gulf of Maine during 2019. DFO Can. Sci. Advis. Sec. Res. Doc. 2020/071. v + 64 p.
DFO. 2019. Oceanographic Conditions in the Atlantic Zone in 2018. DFO Can. Sci. Advis. Sec. Sci. Advis. Rep. 2019/034.
Hebert, D., Layton, C., Brickman, D. and Galbraith, P.S. 2021. Physical Oceanographic Conditions on the Scotian Shelf and in the Gulf of Maine during 2019. DFO Can. Sci. Advis. Sec. Res. Doc. 2021/040. iv + 58 p.
Therriault, J.-C., Petrie, B., Pepin, P., Gagnon, J., Gregory, D., Helbig, J., Herman, A., Lefaivre, D., Mitchell, M., Pelchat, B., Runge, J., and Sameoto, D. 1998. Proposal for a Northwest Atlantic Zonal Monitoring Program. Can. Tech. Rep. Hydrogr. Ocean Sci. 194.